Measuring UI/UX success is crucial for optimizing user experiences and ultimately, driving business growth. A user-centric approach to design, coupled with the analysis of relevant metrics, is essential to gauge the effectiveness of design choices and identify areas for improvement. This article delves deep into the intricacies of measuring UI/UX success, providing a practical framework for evaluating different aspects of the user experience. We’ll explore core metrics and data analysis techniques, equipping you with the knowledge to understand, track, and improve your UI/UX design. The structure of this article will guide you through the essential steps of evaluating UI/UX success, from initial user research to ongoing analysis and iterative improvements.
Defining Success in UI/UX
Understanding User-Centered Design
User-centered design is at the heart of successful UI/UX. Designing with the user in mind means considering their needs, goals, and behaviors throughout the design process. This involves thorough user research, prototyping, testing, and iteration. By focusing on user needs, designers create intuitive and engaging experiences. For instance, a well-designed website with clear navigation and easily accessible information can enhance user satisfaction and increase conversion rates. This iterative approach to design ensures continuous improvement and leads to a more seamless and enjoyable user experience.
Identifying Key Success Factors
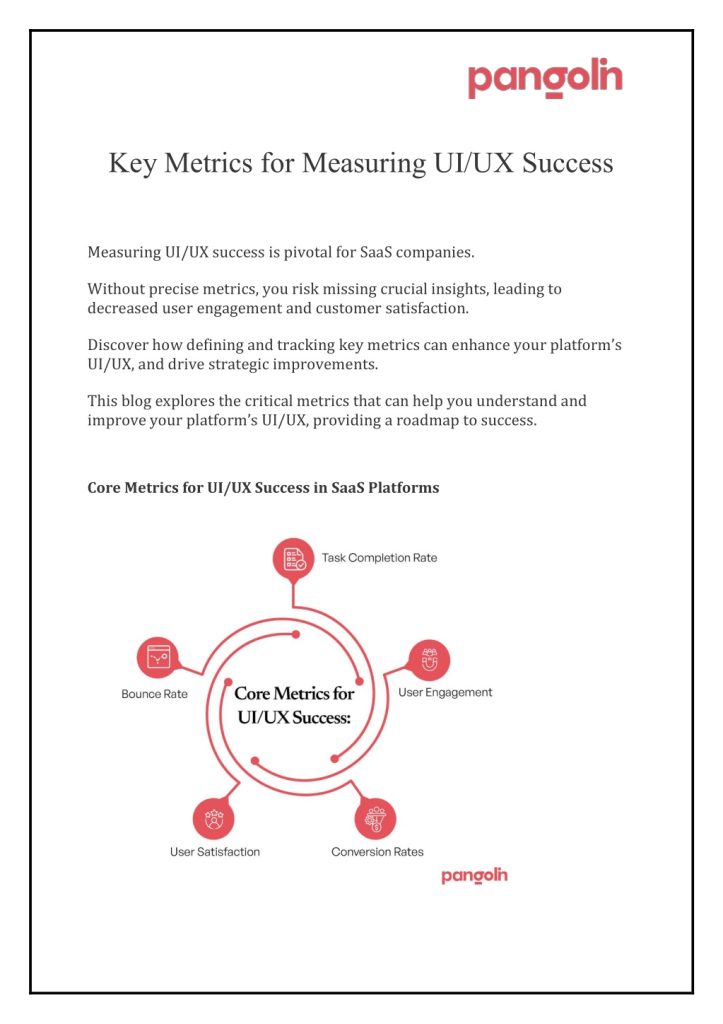
Success in UI/UX is not just about aesthetics. It’s about functionality, efficiency, and user satisfaction. Key aspects include ease of use, speed of task completion, and overall satisfaction. High task completion rates demonstrate ease of use, while reduced bounce rates signal increased user engagement. Measuring user satisfaction scores through surveys or feedback mechanisms provides valuable qualitative data to inform design decisions.
Key Metrics for Evaluating UI/UX Success
User Engagement Metrics
Understanding user engagement is crucial for evaluating UI/UX effectiveness. Metrics like time on site, session duration, and pages per session offer insights into user interest and interaction with the product. A high time on site often indicates a product that is engaging and valuable to the user, while an increase in session duration suggests users are actively using and exploring features. High page views per session can suggest users are finding what they are looking for. By closely examining these metrics, businesses can optimize design to increase user engagement and time spent using the product. For example, if users are leaving the site after a few seconds, the design might need significant improvements for better engagement. Tracking this data provides invaluable information about what resonates with users and what aspects need improvement.
Analyzing User Feedback and Satisfaction
Gathering and Interpreting Feedback
User feedback is an indispensable tool for understanding user experience. Surveys, usability testing, and focus groups offer valuable qualitative data. Understanding the sentiments expressed by users helps identify pain points, areas for improvement, and features that users find valuable. These insights are crucial for enhancing the user experience. User testing can help identify problem areas in a design process. For instance, in a usability test on a new mobile banking app, users may report difficulty in navigating certain screens or completing specific tasks. Analyzing this feedback and addressing the issues will lead to a more effective and enjoyable experience.
User Satisfaction Score (USAT)
Measuring user satisfaction provides a holistic overview of the user experience. Surveys are commonly used to gather USAT data, often incorporating rating scales. By quantifying user satisfaction, businesses can identify areas where improvements are needed. USAT scores can be combined with other metrics for a more comprehensive analysis.
Conversion Rates and ROI
Defining Conversions
Conversion rates are a critical metric for measuring the effectiveness of a UI/UX design. A conversion can be a purchase, a sign-up, or any desired action that a user takes. By monitoring conversion rates, companies can measure the impact of UI/UX design on key business objectives. Analyzing patterns in conversion rates across different user segments can help tailor the user experience to specific needs, improving conversion rates overall. For instance, high conversion rates on a specific landing page might indicate that the design of that page is effective. A low conversion rate, on the other hand, might suggest improvements are needed, such as simplifying the call to action or improving visual appeal.
Connecting UI/UX Success to Business Outcomes
Companies should connect UI/UX success to quantifiable business results. For instance, an optimized user interface for online ordering could lead to a significant increase in sales and a direct positive ROI. Tracking this ROI provides strong data to justify future UI/UX investments.
Related Post : Error Handling in UI/UX: Guiding Users Through Mistakes.
Data Analysis and Reporting
Using Analytics Tools
Data analysis plays a pivotal role in understanding UI/UX success. A variety of analytics tools, including Google Analytics and specialized UX analytics platforms, offer insights into user behavior, trends, and patterns. By leveraging these tools, companies can gain valuable insights into what resonates with users, and identify areas for design improvement. These tools often provide comprehensive data on user journeys, highlighting pain points and areas of high engagement. For example, a heatmap created from a UX analytics platform reveals how users interact with different elements of a website or app. By analyzing these patterns, designers can identify issues, such as obscure buttons or inefficient navigation, which need to be addressed.
Creating Actionable Reports
Transforming data into actionable insights is crucial for UI/UX improvement. Visualizations, such as charts and graphs, help communicate complex data effectively and highlight key trends. Regular reporting ensures that UI/UX improvements align with business objectives. For instance, a report highlighting a significant drop in conversion rates on a specific page allows the design team to identify and address the issue promptly.
Optimizing Design Based on Data Insights
Iterative Design Process
A user-centered approach to design often involves iterative improvement cycles. Analyzing data insights, particularly from user feedback and usability tests, allows for the identification of areas that need refinement. For instance, a user test revealing difficulties in completing a specific task can inspire design changes, ultimately improving the overall user experience.
A/B Testing
A/B testing allows designers to compare different versions of a UI/UX element or design, identifying the version that performs better. By testing different versions of a button design, for example, you can identify the layout and color combination that yields the highest engagement.
Long-Term UI/UX Strategy
Establishing Baselines
Setting benchmarks, or baselines, is important in UI/UX design. Tracking key metrics, such as session duration, bounce rates, and conversion rates, provides a baseline for future analysis. Identifying patterns over time allows for the creation of more refined design and iteration strategies.
Predictive Modeling
Predictive modeling tools are essential for future planning and resource allocation. They help in identifying trends in user behavior and predict future performance based on historical data, aiding in planning for UI/UX enhancements.
In conclusion, effectively measuring UI/UX success hinges on a well-defined strategy encompassing key metrics and robust analytics. By tracking user engagement, task completion rates, and user satisfaction scores, businesses can gain valuable insights into user experience and adapt their designs accordingly. Implementing these strategies empowers businesses to not only optimize their user experience but also to demonstrate the tangible value of their UI/UX efforts. Ready to elevate your user experience and unlock measurable success? Contact us today for a free consultation.